Fitness Data Analytics
R programming
Fitness Tracker Data Analysis
This analysis explores a public dataset of Fitbit users to uncover potential insights into activity habits and health trends.
Key Questions:
-
Exercise Minutes: How much exercise do Fitbit users typically log per week?
This can be compared to the recommended 150 minutes of moderate activity for maintaining a healthy lifestyle. -
Steps and Activity Levels: What is the average number of daily steps, categorized by activity levels?
Understanding these patterns can reveal user preferences and highlight opportunities for wearables and coaching programs. -
Activity Patterns: When are users most active throughout the day and the week?
These insights can help identify peak activity periods and encourage more consistent physical activity.Analysis:
Tools: R packages (
tidyverse,scale)
Data Source: The dataset is publicly available on Kaggle (Fitbit Fitness Tracker Data) and is classified as 100% complete, credible, and compatible.Sample Overview:
The dataset contains activity data from 33 Fitbit users over one month. However, several limitations should be considered:- Small Sample Size: The dataset includes only 33 users, which limits the generalizability of insights.
- Missing Contextual Information: There is no data on participants’ gender, occupation, or location.
- Incomplete Tracking: Some users did not log their activity daily, leading to potential biases and missing data for certain days.
Low Activity Levels:
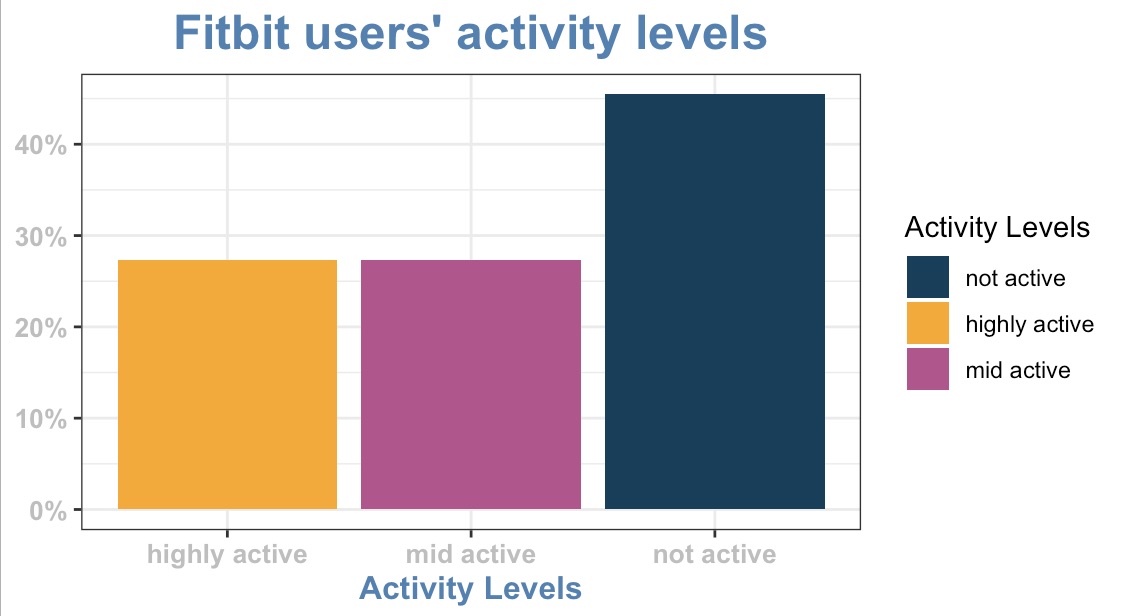
- Finding: A significant portion (45%) of users exhibit low activity levels.
- Insight: This highlights an opportunity for Bellabeat to target women who struggle to meet activity recommendations.
- Action: Develop marketing messages and products that cater to this segment, focusing on low-impact activities like brisk walking.
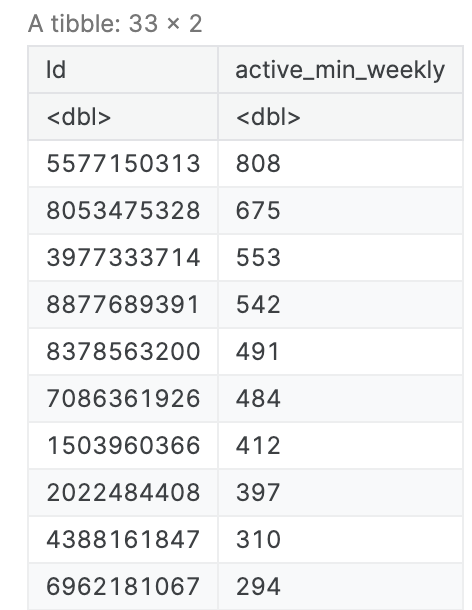
Calculation the average weekly exercise minutes for Fitbit users. (Top 10 active min)
Compare the average to the recommended 150 minutes.
Highly active: Exercise minutes > = 295 min;
Mid Active: Exercise minutes 295min-150min;
Not Active: Exercise minutes <150 min;
Steps Below Recommendation:
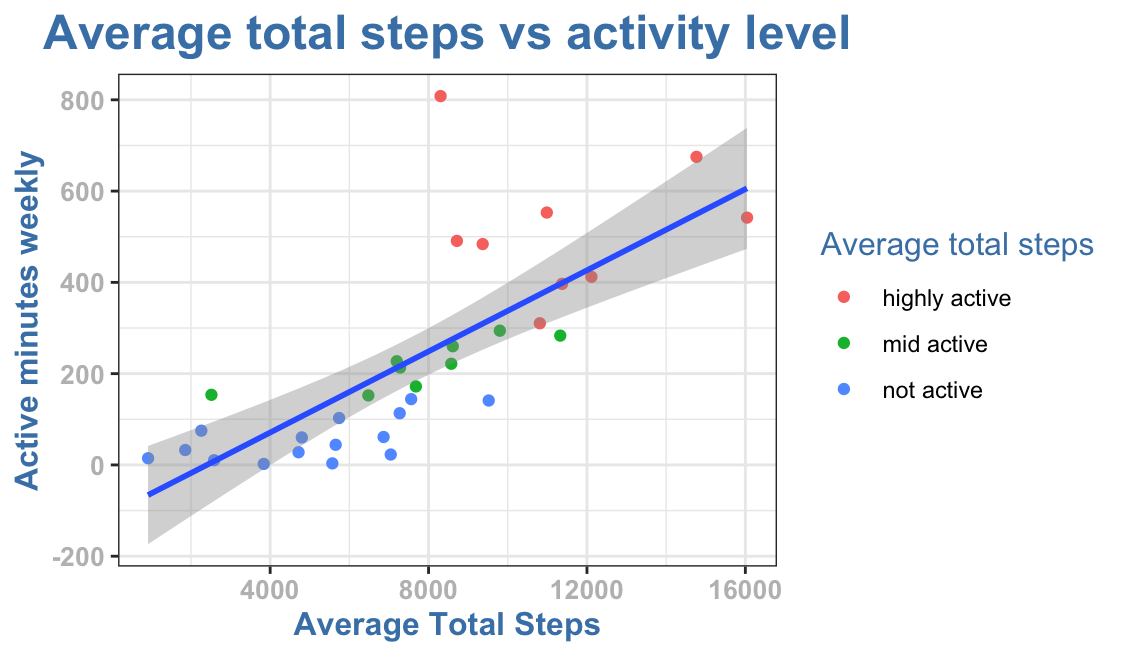
- Finding: The average user doesn’t reach the recommended 10,000 daily steps.
- Insight: This suggests a need for products or features that encourage users to be more active.
- Action: Highlight features in the app or wearables that promote increased activity, such as step challenges or gamification elements.
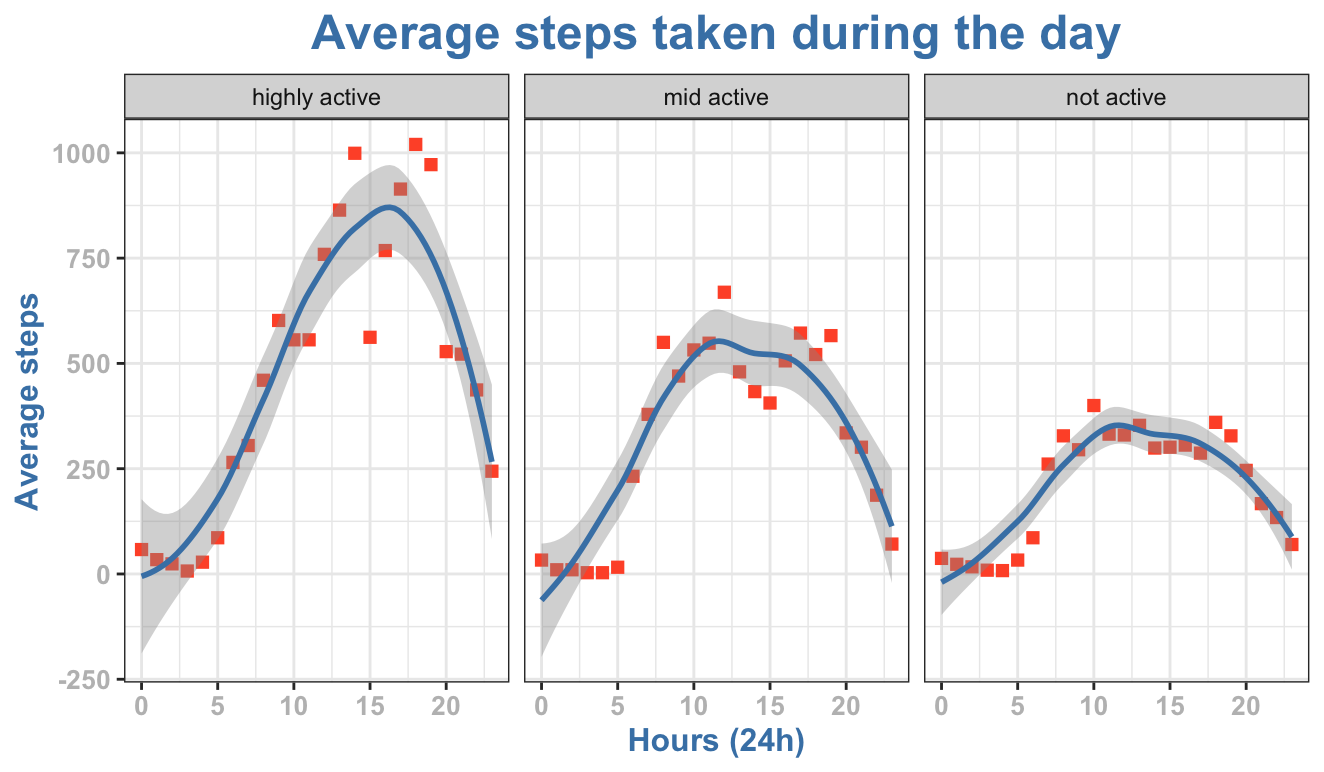
Daily Activity Patterns:
- Finding: Step counts rise for all groups after 6 pm. The more active groups have higher average steps throughout the day.
- Insight: This suggests potential for evening activity promotion and highlights the importance of encouraging consistent activity throughout the day for all users.
- Action: Consider offering evening activity suggestions or reminders within the app. Develop strategies within the app to motivate users to maintain activity levels throughout the day.
Weekend Activity Patterns:
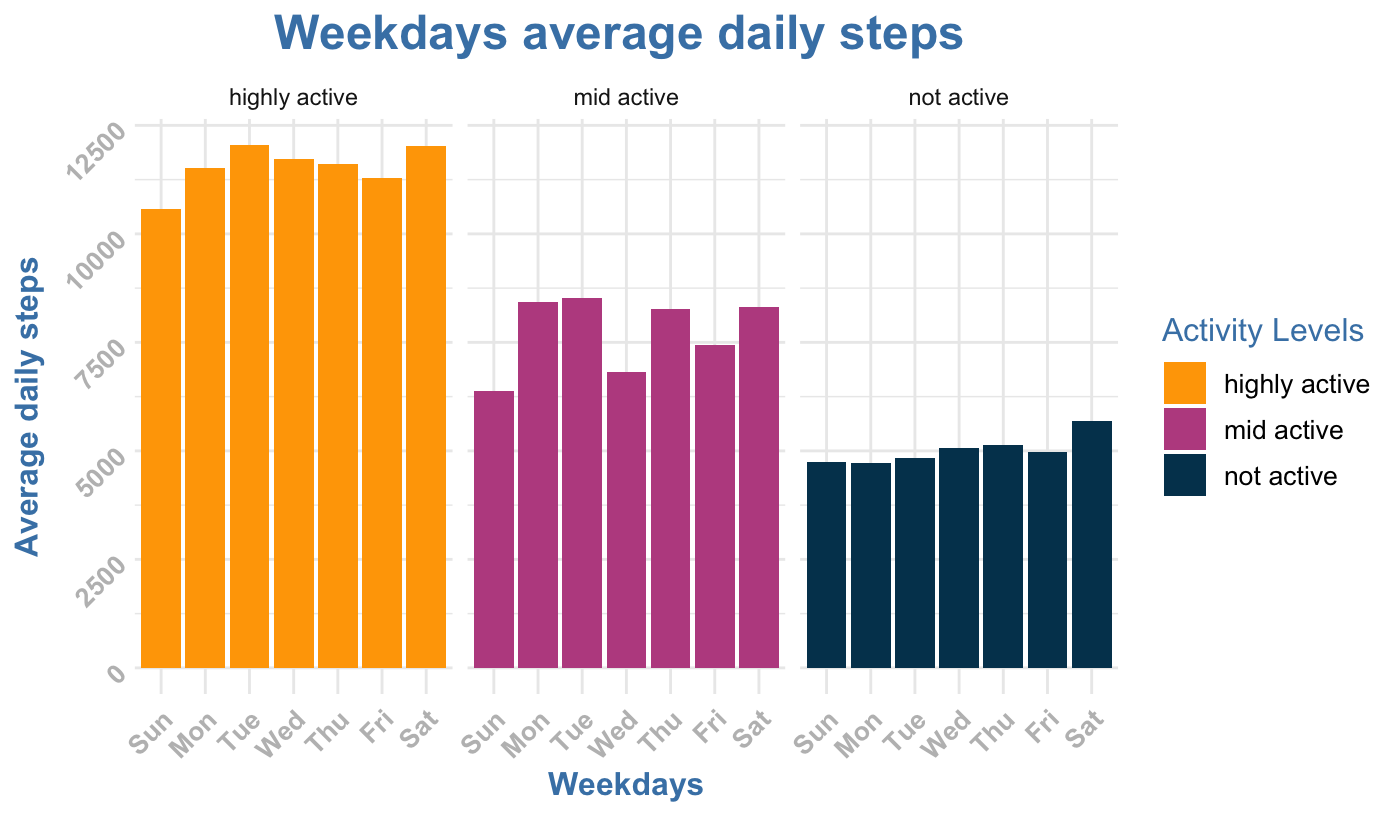
- Finding: All activity groups see a decrease in steps on Sundays and higher steps on Saturdays (particularly in the low activity group).
- Insight: This suggests weekends offer more time for physical activity, especially for those with lower baseline activity during the week.
- Action: Develop targeted weekend activity challenges or content to capitalize on this increased leisure time.
