Legal Business
Interactive Dashboard by Power BI
Legal Services Interactive Dashboard
Explore 12 months of business performance at a glance! This interactive Power BI dashboard transforms data into an engaging story, revealing month-to-month trends and hidden insights.
Top Highlights:
✨ KPI Cards front and center—keeping you up to speed on Revenue, Total Cases, Open Cases, and Closed Cases.
✨ Slicers & Bookmarks—your personal control panel for instant exploration and tailored insights.
✨ Decomposition Tree—because every detail matters! Dive deep and uncover patterns you didn’t know existed.
This dashboard is designed to make data come alive, empowering smarter decisions and sparking new ideas.
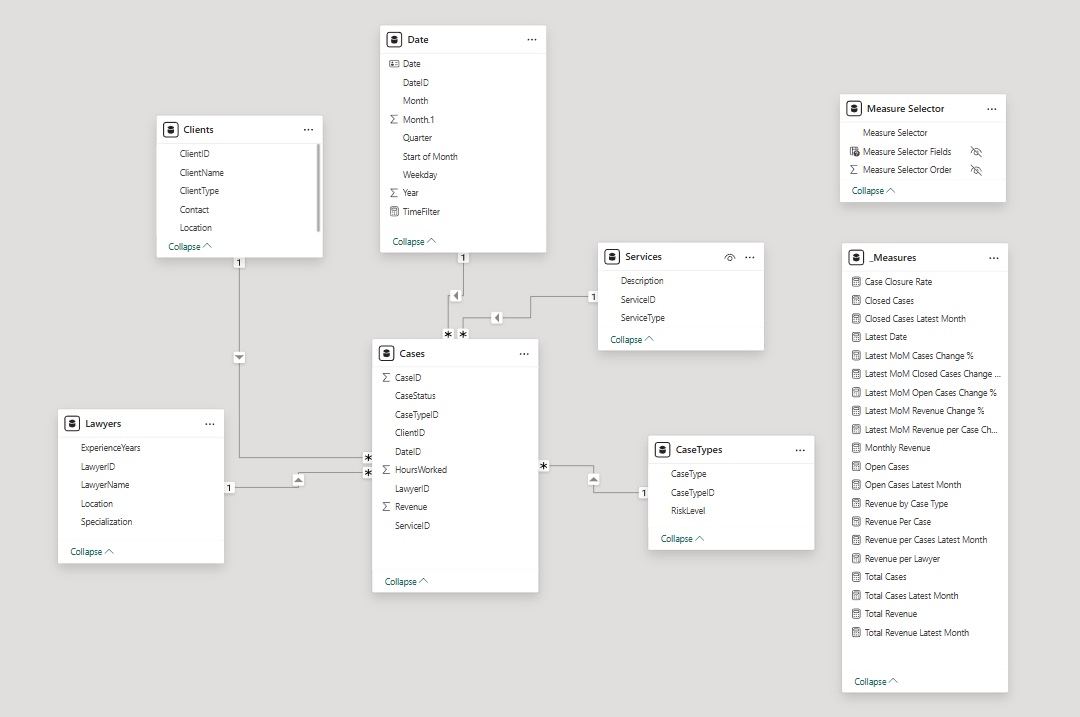
✅ Designed a Star Schema Data Model – Created a structured fact-dimension relationship to optimize performance and reporting.
✅ Developed an Interactive Dashboard – Integrated multiple visuals, including KPI cards, bar charts, line charts, and decomposition trees to explore legal case performance.
✅ Implemented Advanced DAX Measures – Built calculations for total revenue, case closure rates, lawyer workload, and dynamic time filters.
✅ Enabled Dynamic Time Analysis – Created a custom time slicer and dynamic line chart to track trends across different periods.
✅ Utilized a Decomposition Tree – Provided drill-down insights into case volume and revenue distribution by lawyer, case type, and client location.
✅ Ensured Data-Driven Decision Making – Designed the dashboard to help legal firms optimize resources and improve service delivery.

Star Schema Data Model
