Accounts Payable Insights
Invoice Analysis – Data Preparation, Modelling & DAX
Project Context
This report is based on a fictional UK charity, Cats & Paw Care, created to reflect a realistic accounts payable environment within the animal welfare sector.
Cats & Paw Care works with a wide range of suppliers, including veterinary services, food and medication providers, property and facilities partners, as well as IT and legal services. As with many charities, timely invoice processing is essential to ensure smooth operations and uninterrupted care delivery.
The dataset and company scenario are fully fictional but inspired by real-world finance operations, allowing the project to focus on practical, business-relevant analytics while remaining portfolio-safe.
Introduction
The purpose of this report is to demonstrate the foundational stages of a finance analytics solution, with a focus on data quality, model design, and clear business logic.
At this stage, the emphasis is on accuracy, structure, and scalability rather than visual design.
This approach reflects how reporting solutions are typically built in real finance environments — starting with trusted data and a robust analytical foundation before moving on to visualisation and insight delivery.
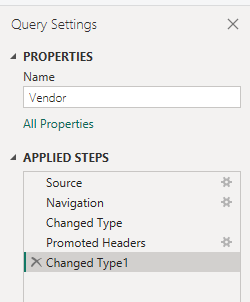
Data Preparation (Power Query)
Invoice data was prepared in Power Query to ensure consistency and reliability for analysis.
Key preparation steps included:
-
Standardising data types and date formats
-
Handling missing or inconsistent values
-
Aligning categorical fields used for reporting and filtering
-
Creating reusable transformations to support future extensions
Result: Clean, analysis-ready tables that safely support data modelling and DAX calculations.
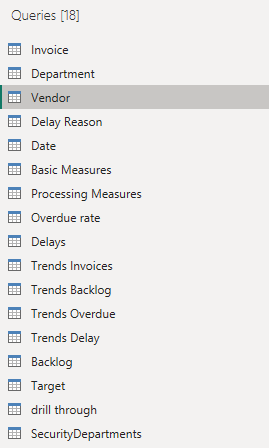
Data Model (Star Schema)
A star schema was designed to keep the model intuitive, performant, and easy to maintain.
Key modelling decisions included:
-
Clear separation of the fact table (Invoices) and supporting dimension tables
-
A dedicated Date table to enable consistent time intelligence
-
Simple, single-direction relationships to avoid ambiguity and filtering issues
This structure ensures that DAX measures remain readable and that the model can scale as new metrics or dimensions are added over time.

Dax & Business Logic
DAX measures were used to translate invoice-level data into consistent, business-ready KPIs that support both operational monitoring and trend analysis.
The measures were structured around a clear distinction between base metrics (such as invoice volumes, backlog, overdue rate and processing time) and derived measures that introduce time-based comparison logic. This layered approach improves readability, reusability, and long-term maintainability of the model.
Time intelligence calculations rely on the dedicated Date table to ensure consistent period comparisons across the report. A key example from this stage is the month-over-month change in overdue rate (percentage points). Rather than expressing the change as a relative percentage, this measure compares the current overdue rate to the previous month and returns the difference in percentage points, providing a clearer and more actionable operational signal.
This approach ensures that changes in overdue performance are easy to interpret and aligned with how finance teams typically monitor risk and process efficiency.


Next Stage
The next stage of this project will extend the analytical foundation with a focus on visual design, usability, and enterprise data management concepts, including role-based access and Row-Level Security (RLS).