Call Centre Report
Interactive Dashboard by Excel
Call Centre Dashboard
Welcome to our Call Centre Dashboard – an Excel-powered solution that transforms one year of data into clear, actionable insights. This study project, brings together key performance metrics from call volumes and durations to customer ratings and representative rankings, all designed to boost your call centre’s efficiency and customer satisfaction.
Our solution integrates two core data tables – Calls and Customers – to comprehensively view your call centre performance.
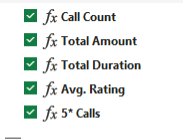
Using advanced pivot tables and custom measures, the dashboard highlights key metrics such as:
- Total Calls: Track the overall volume of incoming and outgoing calls.
- Call Duration: Analyze the cumulative time spent on calls for better resource allocation.
- Average Rating: Monitor customer satisfaction through average call ratings.
- 5-Star Callers: Identify and prioritize interactions that achieve the highest customer approval.
Additionally, the dashboard features a detailed performance breakdown for five dedicated representatives. It calculates each representative’s:
- Percentage of Total Calls: Understand individual call contributions.
- Call Rank: Compare performance rankings based on call volume.
- Amount Rank: Evaluate revenue or other financial metrics by rank.
This streamlined dashboard empowers managers to make data-driven decisions, optimize team performance, and enhance customer service strategies. Whether you’re looking to benchmark performance or identify areas for improvement, our call centre dashboard delivers the insights you need to drive success.
| Call Count | Total Amount | Total Duration | Avg. Rating | 5* Calls |
| 200 | £20,104 | 18,209 | 3.9 | 51 |

